1
2
3
4
5
6
7
8
9
10
11
12
13
14
15
16
17
18
19
20
21
22
23
24
25
26
27
28
29
30
31
32
33
34
35
36
37
38
39
40
41
42
43
44
45
46
47
48
49
50
51
52
53
54
55
56
57
58
59
60
61
62
63
64
65
66
67
68
69
70
71
72
73
74
75
76
77
78
79
80
81
82
83
84
85
86
87
88
89
90
91
92
93
94
95
96
97
98
99
100
101
102
103
104
105
106
107
108
109
110
111
112
113
114
115
116
117
118
119
120
121
122
123
124
125
126
127
128
129
130
131
132
133
134
135
136
137
138
139
140
141
142
143
144
145
146
147
148
149
| import React, { Component, createRef } from 'react';
import * as echarts from 'echarts';
import axios from 'axios';
export default class index3 extends Component {
constructor(props) {
super(props);
this.state = {
myEchartList: [],
data1: [],
data2: [],
data3: [],
data4: [],
};
this.allRef = [];
}
componentDidMount() {
this.setState({
myEchartList: this.allRef.map((item) => echarts.init(item)),
});
this.initDataA();
this.initDataB();
}
initDataA = () => {
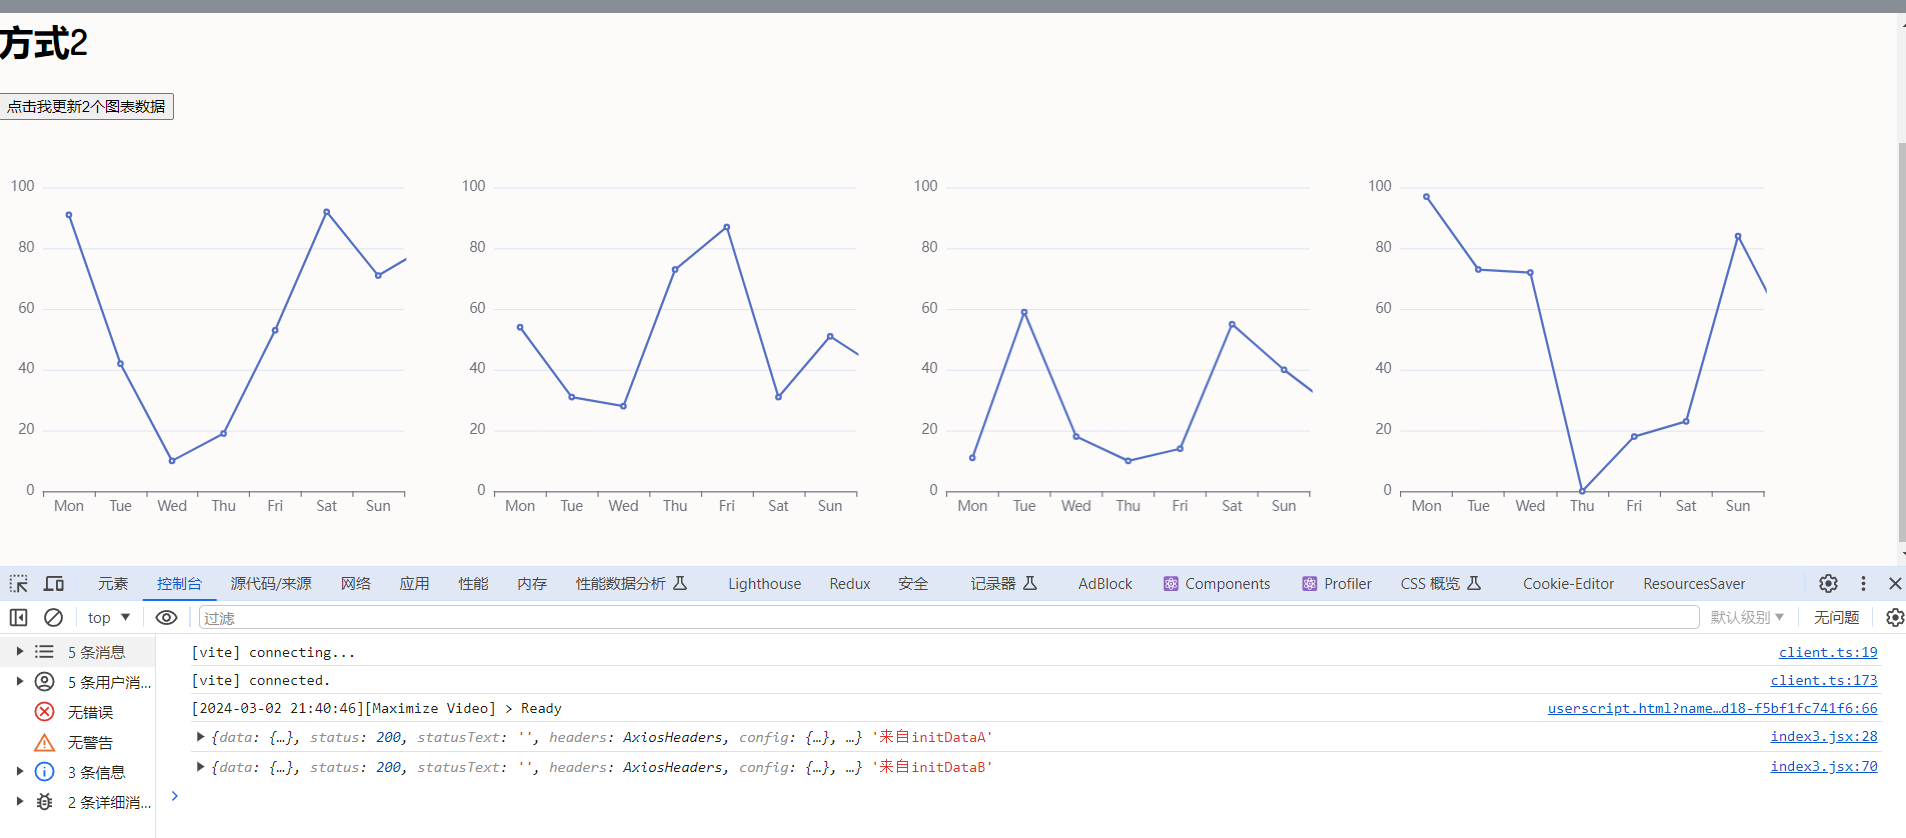
axios.get('https://api.oick.cn/api/lishi').then((res) => {
console.log(res,'来自initDataA');
let data1 = res.data.result.map(() => Math.round(Math.random() * 100));
let data2 = res.data.result.map(() => Math.round(Math.random() * 100));
this.setState({
data1,
data2,
});
this.state.myEchartList[0].setOption({
xAxis: {
type: 'category',
data: ['Mon', 'Tue', 'Wed', 'Thu', 'Fri', 'Sat', 'Sun'],
},
yAxis: {
type: 'value',
},
series: [
{
data:data1,
type: 'line',
},
],
});
this.state.myEchartList[1].setOption({
xAxis: {
type: 'category',
data: ['Mon', 'Tue', 'Wed', 'Thu', 'Fri', 'Sat', 'Sun'],
},
yAxis: {
type: 'value',
},
series: [
{
data:data2,
type: 'line',
},
],
});
});
};
initDataB = () => {
axios.get('https://api.oick.cn/api/lishi').then((res) => {
console.log(res,'来自initDataB');
let data3 = res.data.result.map(() => Math.round(Math.random() * 100));
let data4 = res.data.result.map(() => Math.round(Math.random() * 100));
this.setState({
data3,
data4,
});
this.state.myEchartList[2].setOption({
xAxis: {
type: 'category',
data: ['Mon', 'Tue', 'Wed', 'Thu', 'Fri', 'Sat', 'Sun'],
},
yAxis: {
type: 'value',
},
series: [
{
data:data3,
type: 'line',
},
],
});
this.state.myEchartList[3].setOption({
xAxis: {
type: 'category',
data: ['Mon', 'Tue', 'Wed', 'Thu', 'Fri', 'Sat', 'Sun'],
},
yAxis: {
type: 'value',
},
series: [
{
data:data4,
type: 'line',
},
],
});
});
};
handleUpdate = () => {
this.initDataA();
};
render() {
return (
<>
<button onClick={this.handleUpdate}>点击我更新2个图表数据</button>
<div
style={{ display: 'flex' }}
>
<div
ref={(node) => {
this.allRef.push(node);
}}
style={{ width: '401px', height: '400px' }}
></div>
<div
ref={(node) => {
this.allRef.push(node);
}}
style={{ width: '402px', height: '400px' }}
></div>
<div
ref={(node) => {
this.allRef.push(node);
}}
style={{ width: '403px', height: '400px' }}
></div>
<div
ref={(node) => {
this.allRef.push(node);
}}
style={{ width: '404px', height: '400px' }}
></div>
</div>
</>
);
}
}
|