canvas基本使用
canvas的基本了解
canvas仅仅只是一个画布,定义一个canvas标签,需要通过属性,属性,属性来设置宽度高度(不可以通过样式!),如果不设置默认
300*150- 不通过属性设置画布的宽度和高度,会造成坐标不准确的问题!
canvas必须要通过js来操作
canvas的坐标是从左到右是x轴,从上到下是y轴
vscode书写canvas的时候没有提示,加上
/** @type {HTMLCanvasElement} */1
2
3
4<script>
/** @type {HTMLCanvasElement} */
canvas代码书写
</script>
canvas的基本步骤
- 获取canvas的节点
- 画布创建画笔并选择画笔的绘制类型
- 开始绘制
- store()方法绘制 —— stroke() 方法会实际地绘制出通过 moveTo() 和 lineTo() 方法定义的路径。默认颜色是黑色。
1 | <canvas id="cav" height="400" width="400"></canvas> |
绘制效果
如果想要填充的颜色,画笔可以设置fillStyle指明颜色并且调用fill()方法进行填充
1
2
3
4//设置填充颜色 - 红色
ctx.fillStyle = "red";
//开始填充
ctx.fill();
设置线条的颜色
1
2
3
4//设置绘制线条的颜色
ctx.strokeStyle = "yellow";
//设置绘制线条的粗细
ctx.lineWidth = "20";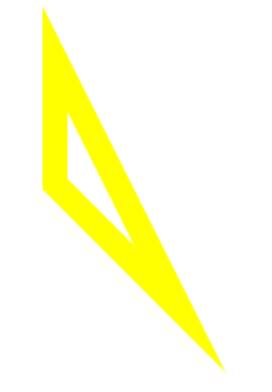
canvas绘制矩形和圆
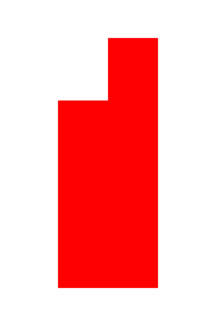
绘制矩形
- 画笔使用
storeRect()方法 - 画笔使用
fillRect()方法
1 | var cav = document.getElementById("cav"); |
绘制圆
画笔使用
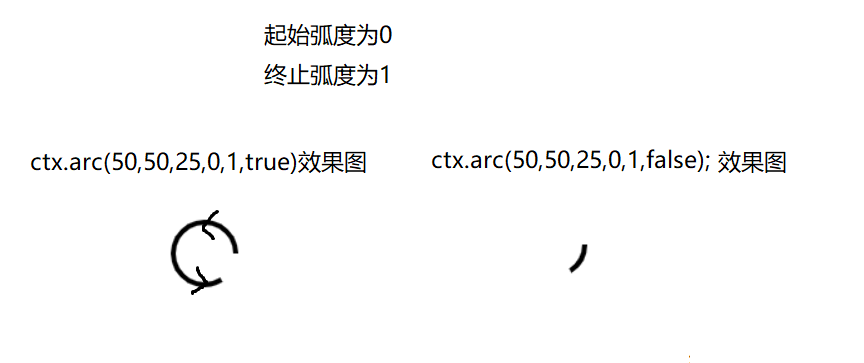
arc()方法ctx.arc(x, y, radius, startAngle, endAngle, anticlockwise);
X,Y,radius分别是横坐标,纵坐标,半径startAngle:圆弧的起点,x轴方向开始计算,单位以弧度表示- (1弧度等于57度左右) 因为2PI弧度=360所以1弧度=57度
- 所以绘制一个圆直接起始弧度为
0,终点弧度为2*Math.PI即可
endAngle:圆弧的终点,单位以弧度表示anticlockwise:可选的Boolean值 ,如果为true,逆时针绘制圆弧,反之,顺时针绘制。注意,是绘制,绘制,绘制!,比如其他参数相同,唯独最后一个参数不同,那么图形是完全不同的
如图 ctx.arc(50,50,25,0,1,false);顺时针和逆时针绘制效果
1 | var cav2 = document.getElementById('cav2'); |
绘制字体
- 画笔设置
font属性可以设置字体的格式 - 画笔调用
fillText可以绘制字体- ctx.fillText(text, x, y, [maxWidth]);
text: 绘制的文本x,y: 坐标maxWidth: 绘制的最大宽度。如果指定了值,并且经过计算字符串的值比最大宽度还要宽,字体为了适应会水平缩放(如果通过水平缩放当前字体,可以进行有效的或者合理可读的处理)或者使用小号的字体。
1 | <canvas id="cav" height="400" width="400"></canvas> |
清空画步和清除指定区域
- 均使用画笔当中的clearRect方法,只是传入的值有所区别
- ctx.clearRect(x, y, width, height);
X,Y: 开始清空的坐标width: 清空的宽度height: 清空的高度
清空画布
- ctx.clearRect(0,0,画布的宽度,画布的高度);
清除指定区域
ctx.clearRect(0,0,40,50)
效果
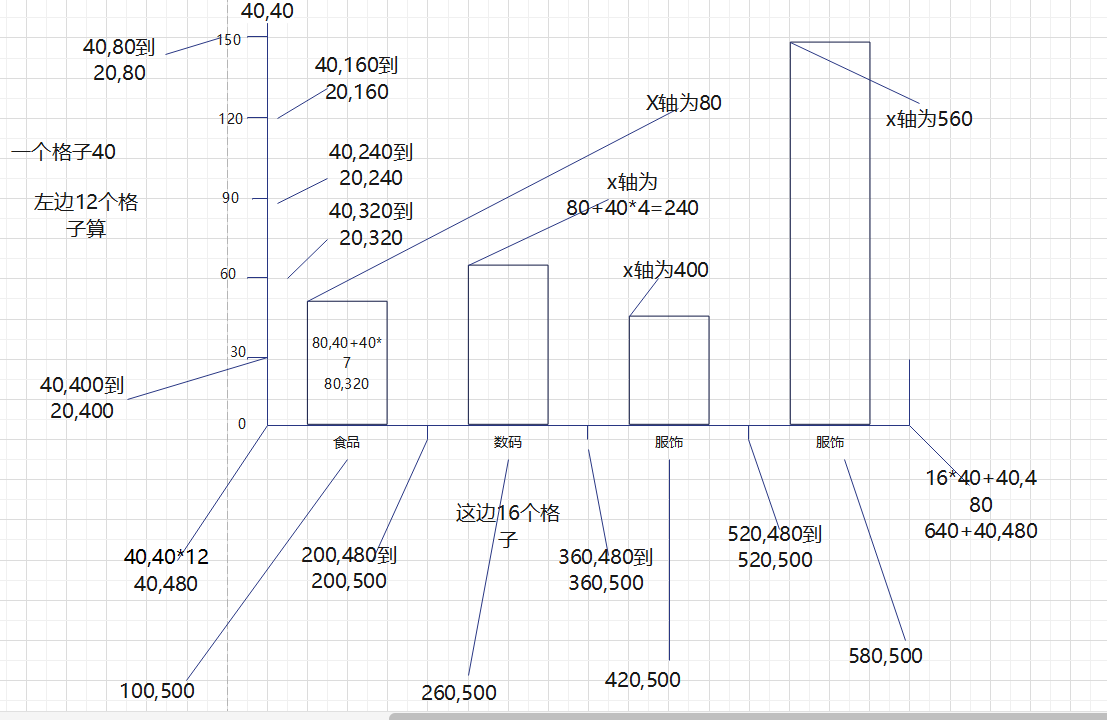
canvas绘制一个柱形图
效果
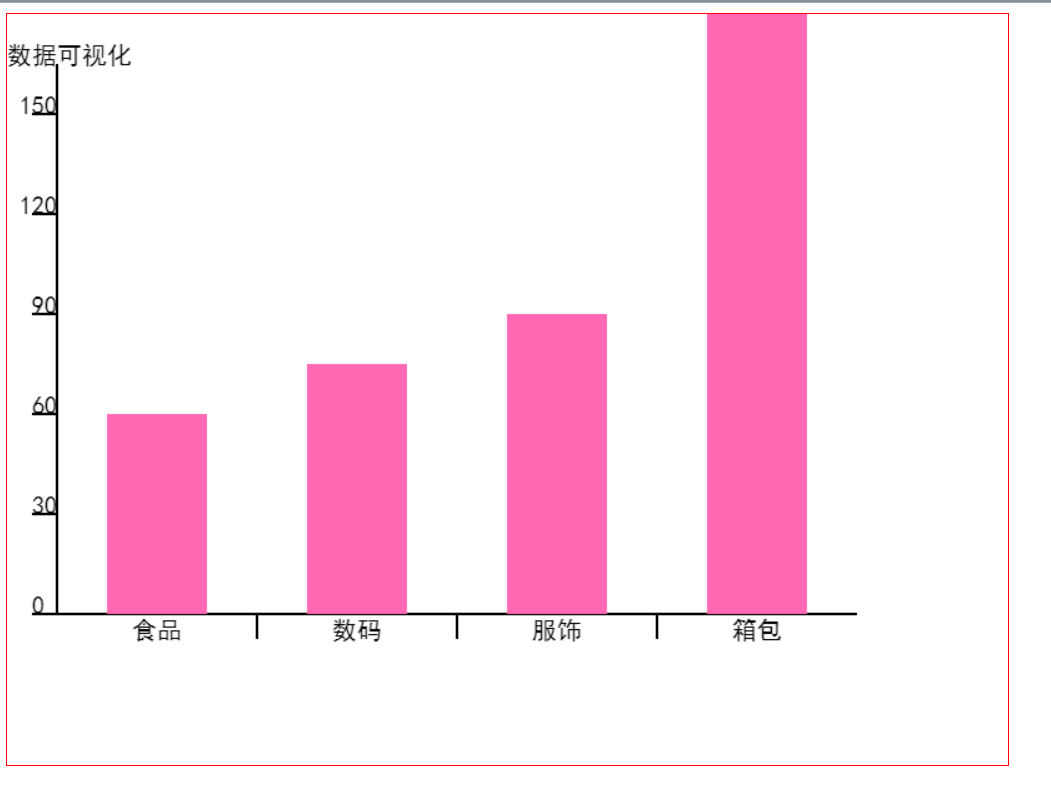
代码
1 |
|
过程图
本博客所有文章除特别声明外,均采用 CC BY-NC-SA 4.0 许可协议。转载请注明来自 梦洁小站-属于你我的小天地!
相关推荐

评论
